Aligning data from multiple tables can be achieved in several ways. Cascading Power Apps Galleries, creating virtual tables using AddColumns, even simply using the humble Label. These techniques can be combined together to deliver the best solution
Galleries and Relational Data
Power Apps Galleries are great at displaying tables. They are quick and easy to use and filtering or sorting data is pretty straightforward as I’ve shown in earlier posts
One of the limitations of Power Apps Galleries though (at least at the time of writing) is that they can’t be used to directly display the data from multiple tables at the same time. You can write a formula to try and do this and often don’t get an error message, but no data is displayed… There is a way around this limitiation though, using the AddColumns function
In order for tables to be linked they need a common element of data to be the Primary Key so the tables act as a pseudo relational database. The actual data source itself doesn’t matter, the tables can be hosted in Excel, SharePoint, Azure Server, CDS or across different data sources. Its the data in the table that matters. The data linked by the Primary Key common to two tables can have a Many to Many relationship , One to Many or a One to One relationship.
In the example below, Continents, Countries and Capitals are three seperate tables. ‘Continent’ is the Primary Key that links Continents to Countries and the Primary Key that links Countries to Capitals is ‘Country’
The is a One to Many relationship between Continents and Countries ie One Continent consists of Many Countries. There is a One to One relationship between Countries and Capitials because one Country has One Capital City. Many to Many relationships also exist such as the case of Russia which is located mainly in Asia but also in Europe too
Cascading Galleries
Cascading Galleries work by taking the output from the parent Gallery and use it to filter the child Gallery. Below you can see this in use to drill down to find a capital city
The following has been assigned to the Items propery of the Country Gallery to display each of the Countries for the defined Continent
This approach generally works well when there is a One to Many relationship, which is the case with Continents to Countries. Under these circumstances, the Galleries act as a cascading menu. When it comes to a One to One relationship (such as Countries to Capital Cities) the use of Galleries is less useful because the final Gallery displays a single record and that is not what Galleries are design for
Displaying in a List Format
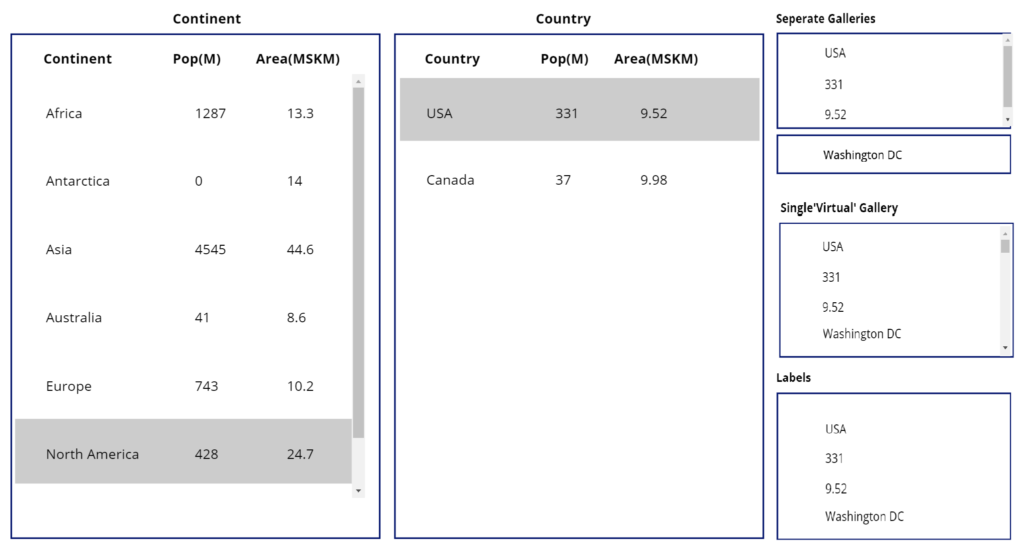
A alternative solution could be to show the data for the selected Country in a different way. Rather than showing a Gallery with just the Capital City the data could be grouped with the info on individual Countries and displayed in a list format. As I’ve already explained, Galleries can’t show data from two seperate tables at the same time, so we have to be creative. Below are 3 ways to show exactly the same data in the same format
Seperate Galleries: In the first example, a varient of the Country Gallery and the Capital City Galleries are stacked and could be made to look like a single set of data
Single ‘Virtual’ Gallery: The second option shows a single ‘virtual’ table display in a Gallery created using the AddColumns function. More on AddColumns later in this article
Labels: The final approach is probably the most simple and effective for this particular example. It consists of four seperate labels getting the filtered data from either the Countries table, as in the example below of the fist label returning the name of the Country
Country_Table.Selected.Country
Or using Lookup to get the respective Capital City from the Capital table via the primary key
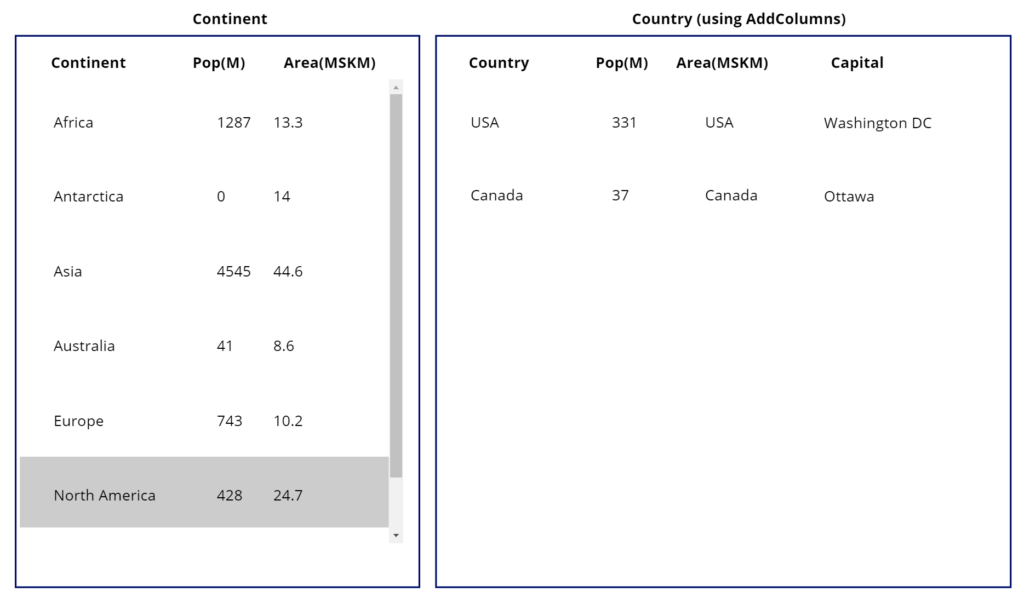
The AddColumns function takes the existing table and adds a ‘virtual’ column to the table. The values assigned to the virtual column are defined by a formula. It’s important to note that AddColumns doesn’t modify the original table
Above, the column containing the Capital City from the Capitals table has been added to the Countries table by using the formula below in the Galleries Items property. The Filter applied to the ‘parent’ Gallery works exact as previously
This is a far better solution than the two previous options
First we only need two tables rather than 3. The big white space created by Gallery 3 in option 1 can be put to better use. Also the duplication of data in option 2 no longer exists
Secondly and more importantly, the Capital of each of the Countries is displayed for the selected Continent. We don’t need to select a country to see it’s capital